Geochart
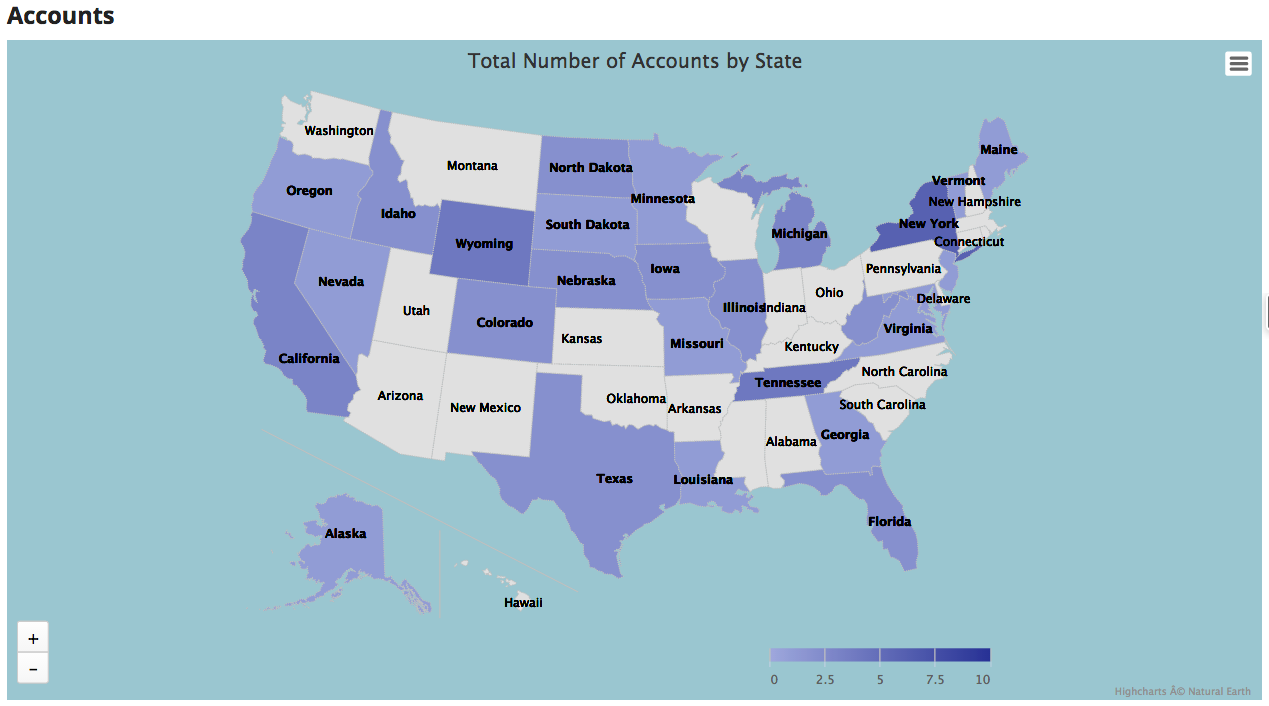
Geocharts display data in a geographic region using a type of thematic mapping called a choropleth map. This means areas on the map are shaded in relation to the data being displayed on the map.
Before you chart, think about why to chart.
The Accepted Data Format for Geocharts
The default maps used with the Geochart component require data to be formatted according to ISO codes: ISO 3166-1 alpha-2 (for countries) and ISO 3166-2 (for the principal subdivisions such as states, parishes, provinces, regions, territories) of any country. For counties in the United States, Geocharts require the County FIPS Code.
Warning
For some countries, the 2-digit ISO-3166 listed codes do not cover all the country subdivisions. For additional options, see the Highcharts documentation on custom GeoJSON mapping.
Using the Geochart Component
Geochart gives you the ability to display groupings of regional data. If your company does business across the globe, you might want to visualize where you have the highest number of customers. Geocharts can display the total number of customer accounts in each country based on the data in a field that records the account’s country.
Note
The content below assumes you have a Skuid page and at least one working model with fields selected.
Warning
Be sure to include fields that reference country, state/province, and/or country data. If geographic fields are not included in the model, the geochart will be unable to display regional data.
AAfter you add a Geochart component to the canvas, set it up:
- In the Basic tab, choose a Title and connect the geochart to a model. Then choose the map group and map type.
- In the Series tab, select the data that will be displayed on the geochart. If you want to use Buckets to color-code different ranges, do that here as well.
Then customize its appearance:
- Use the Display tab to adjust the layout of the geochart.
- The Conditions tab lets you control when (or if) the geochart is displayed.
Print or download the chart
Print or download the runtime chart (in PNG, JPEG, PDF, or SVG formats) by selecting options from the hamburger menu at the top of the chart.
Note
SVG vector images scale to massive sizes—useful if you want to make a poster of the chart.
Properties
(Just need to look up a property? Try going directly to the Property Library.)
Component properties
Troubleshooting
Your graph or chart shows an unexpectedly low number of records. [[]]
Check if there’s a number in the Max # of records field on the model used for the geochart. This number represents the record limit; to see all records represented in the geochart, delete this number and leave the field blank.
Skuid on Salesforce users [[]]
Not getting any data when using the Salesforce fields Account.BillingCountry and Account.BillingState for Series > Country Field and Series > State field?
If you’ve been using the ISO 3166 2-digit coding format, linked Country Field and/or State Field will display correctly in standard Geocharts.
However, if using a different standard (like IANA) or full-text strings for countries/states, then the Geochart will not display the expected results. Skuid requires 2 digit ISO codes for the Country and State fields.
If State and Country Picklists are enabled in your org, then try using Account.BillingCountryCode and Account.BillingStateCode instead. (You may need to “turn on” State and Country picklists in Salesforce.)
Note
Additionally, if end users have not been consistent when entering geographic names, it may be necessary to scrub the data to identify and correct erroneous entries. To change geographical data, follow Salesforce’s documentation on Implementing State and Country Picklists. If you follow this path, then you need to be aware that you cannot simply rollback from this implementation! We recommend that you carefully weigh the pros and cons of this type of implementation.