Geochart
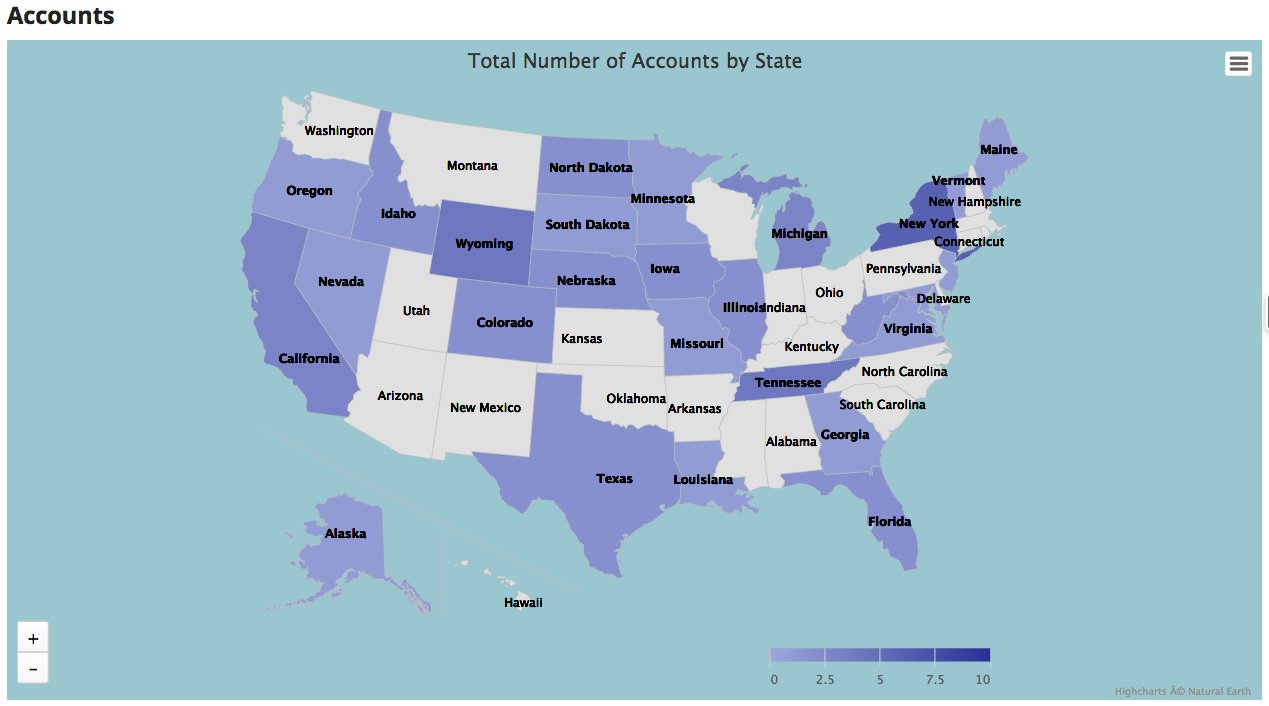
Geocharts display data in a geographic region using a type of thematic mapping called a choropleth map. This means areas on the map are shaded in relation to the data being displayed on the map.
Before you chart, think about why to chart.
The Accepted Data Format for Geocharts
The default maps used with the Geochart component require data to be formatted according to ISO codes: ISO 3166-1 alpha-2 (for countries) and ISO 3166-2 (for the principal subdivisions such as states, parishes, provinces, regions, territories) of any country. For counties in the United States, Geocharts require the County FIPS Code.
Using the Geochart Component
Geochart gives you the ability to display groupings of regional data. If your company does business across the globe, you might want to visualize where you have the highest number of customers. Geocharts can display the total number of customer accounts in each country based on the data in a field that records the account’s country.
Note
The content below assumes you have a Skuid page and at least one working model with fields selected.
Warning
Be sure to include fields that reference country, state/province, and/or country data. If geographic fields are not included in the model, the geochart will be unable to display regional data.
After you drag and drop a Geochart component into the canvas, set it up:
- In the Basic tab, choose a title and connect the geochart to a model. Then choose the map group and map type.
- In the Series tab, select the data that will be displayed on the geochart. If you want to use Buckets to color-code different ranges, do that here as well.
Then customize its appearance:
- Use the Styling tab to adjust the look and feel of the geochart.
- Conditional Rendering lets you control when (or if) the geochart is displayed.
Print or download the chart
Print or download the runtime chart (in PNG, JPEG, PDF, or SVG formats) by selecting options from the hamburger menu at the top of the chart.
Note
SVG vector images scale to massive sizes—useful if you want to make a poster of the chart.
Troubleshooting
- Your graph or chart shows an unexpectedly low number of records. Check if there’s a number in the Max # of Records field on the model used for the geochart. This number represents the record limit; to see all records represented in the geochart, delete this number and leave the field blank.
Skuid on Salesforce users [[]]
Not getting any data when using the Salesforce fields
Account.BillingCountryandAccount.BillingStatefor Series > Country Field and Series > State field? If you’ve been using the ISO 3166 2-digit coding format, linked Country Field and/or State Field will display correctly in standard Geocharts.However, if using a different standard (like IANA) or full-text strings for countries/states, then the Geochart will not display the expected results. Skuid requires 2 digit ISO codes for the Country and State fields.
If State and Country Picklists are enabled in your org, then try using
Account.BillingCountryCodeandAccount.BillingStateCodeinstead. (You may need to “turn on” State and Country picklists in Salesforce.)Note
Additionally, if users have not been consistent when entering geographic names, it may be necessary to scrub the data to identify and correct erroneous entries. To change geographical data, follow Salesforce’s documentation on Implementing State and Country Picklists. If you follow this path, then you need to be aware that you cannot simply rollback from this implementation! We recommend that you carefully weigh the pros and cons of this type of implementation.
Properties
Basic Tab [[]]
- Title and Subtitle: The title header that sits at the top of the chart; the subtitle sits below it. Both are optional. Title content can be added by:
- Typing in plain text
- Adding a merge variable for a field within the chart’s model using the field picker
- Using global merge variables plus text, for example, {{Model. labelPlural}} by Close Date, which displays at the model name plus the text “by Close Date.” Learn about merge syntax and the global merge variables that can be used in a Chart title/subtitle.
- Model: The model the chart pulls data from.
- Map Group: The specific group that the displayed map belongs to. Choose from:
- Global
- Africa
- Asia
- Europe
- North America
- Oceania
- South America
- Canadian Provinces
- USA States
- Map Type: The individual map to be displayed. (This list changes, depending upon the map group selected.)
Series tab [[]]
Series List [[]]
A series is the collection of data pulled from a model to be used in the chart. Click next to Series List to add a series.
Note
You can create more than one series for a geochart.
Model: The model that is the source of the data. If you have only one model on your page, that model will be the Chart Default. However, if you have multiple models, then the Chart Default is the model selected as the default model under the Basic tab. If you choose a model from the picklist, then another option will display in the Properties section for you:
Aggregate Function: The chart data is aggregated according to the function you select from this picklist: Average, Sum, Max, Min, and Count. You can also choose not to aggregate the data with “None.”
- Data Field: The field in the model that will supply the data.
Note
The available fields are determined by the fields added to the model.
- Country Field: The field in the model that connects the data with a country.
Note
Skuid’s default maps require 2-digit ISO 3166-1 country codes. Country information that does not match this format will not be displayed and cannot be used to associate the data with the appropriate country.
- State Field: The field in the model that connects the data with a state or province.
Note
Skuid’s default maps require 2-digit ISO 3166-2 state/country subdivision codes. State/country subdivision information that does not match this format will not be displayed, and cannot be used to associate the data with the appropriate state or province.
Warning
If you are unable to set series properties, make sure you have the appropriate geographic fields added to the model.
Are you drilling down from country data to state/province data? You need to have data selected for this property, or you won’t see any data when you drill down.
County Field: The field in the model that connects the data with a county.
Buckets [[]]
Instead of using a gradient color scale to represent different ranges, you can intentionally organize regional data into color-coded ranges or “buckets.” Click next to Bucket to add a bucket.
- Label: The name of the bucket to be displayed in the legend below the map. For example, if you are dividing lead opportunities amounts into buckets of $10,000 to $100,000, $100,001 to $500,00, and $500,001 to $1M, you might have three separate buckets labeled:
- Between 10K and 100K
- Between 100K and 500K
- Between 500K and 1M
- From: The starting numerical range for a bucket.
- To: The ending numerical range for a bucket.
- Color: The color used on the map for all regions within the select range. You can use any HTML compatible color.
Styling tab [[]]
The Style tab properties let you customize charts.
Colors [[]]
Click Generate Colors to generate a color swatch and apply it to the chart. The hexadecimal code of the selected colors will appear in the Chart Colors property.
Note
If there are more values in the chart than there are available colors, the component will reuse the colors from the palette starting with the topmost color.
Background Color: The background color of the chart.
Hover Color: The color displayed when mousing over a map area.
Null Color: The color displayed in map areas that have no data.
Back Button Background: If using the drilldown chart feature, the background color for the back button.
Back Button Color: If using the drilldown chart feature, the text color for the back button.
Chart Colors: The hexadecimal code of the colors selected using Generate Colors. Delete individual colors by clicking ; edit colors by changing the hexadecimal code.
Note
Click Add Another Value to add more chart colors (using the color’s hexadecimal code). You can use this feature to build a custom color palette from scratch.
Height [[]]
Height: The height of the chart.
Note
While this feature offers sizing measurements in pixels, em, percentage, vh, or vw, Skuid recommends using pixels only for setting the chart height.
Legend [[]]
This section lets you control the location and layout of the chart’s legend.
Note
Some layout options cannot be combined. For example, you cannot choose Horizontal Alignment/Center and Vertical Alignment/Middle; this would put the legend in the middle of the chart. If you choose conflicting options, the options will adjust to the last choice you made.
- Layout:
- Geochart Default: Layout follows the default settings for the chart.
- Horizontal: The legend is listed horizontally (along the x axis), with items sitting side by side (default).
- Vertical: The legend is listed vertically (along the y axis), with items stacked.
- Off: No legend is displayed.
- Horizontal Alignment
- Geochart Default: Horizontal alignment follows the default settings for the chart.
- Center: The legend is displayed directly above or below the chart, depending on the vertical alignment (default).
- Left: The legend is displayed to the left of the chart.
- Right: The legend is displayed to the right of the chart.
- Vertical Alignment
- Geochart Default: Vertical alignment follows the default settings for the chart.
- Bottom: The legend is displayed at the bottom of the chart (default).
- Middle: The legend is displayed in the middle of the chart.
- Top: The legend is displayed at the top of the chart.
Regions [[]]
Regions lets you style the borders between regions on the map.
- Style: The type of line used for the border. Options include:
- Geochart Default (The default line style for the selected map group/map region.)
- Solid
- ShortDash
- ShortDot
- ShortDashDot
- ShortDashDotDot
- Dot
- Dash
- LongDash
- DashDot
- LongDashDot
- LongDashDotDot
- Width: The width of the line.
- Color: The color of the border line. Use the color picker to select a color or enter the hexadecimal code.
Labels [[]]
This section lets you format the map’s labels.
- Format: The display of the map labels.
- Map Default: The full name of the region.
- Data Value: Displays the actual data based on the aggregate function selected.
- Off: Turns off data label display.
- Short Name: The standard abbreviation for the region.
- Text Color: The color of the label text. Use the color picker to select a color or enter the hexadecimal code.
- Bold Labels: Make labels display as bold text.
- Stroke Color: The color of the border around the labels. Use the color picker to select a color or enter the hexadecimal code.
- Stroke Width (in pixels): The width of the border around the labels.
Warning
At publication time, stroke color and width were not working as intended.
Advanced tab [[]]
Unique Id (optional): Skuid automatically generates an alphanumeric Id for the component; if preferred, give it a practical name.
CSS Class (optional): Assign a CSS class to the component’s DOM element.
Before Render Snippet: Run the selected snippet immediately before the geochart is displayed; used to create advanced display options.
Exporting:
Geochart default: Skuid defaults to client-side processing of the geochart in preparation for export.
Server-side: The geochart object is sent to Highchart’s export server for processing, with results returned to the browser for export.
Note
This option is recommended if you are using JavaScript with the Highcharts API to extend the chart’s capabilities. Client-side processing may not have all of the same of options as the full Highcharts API used by server-side processing.
Client-side: The chart is prepared for export in the browser.
Disabled: No chart export options are presented to the user.
Rendering tab [[]]
Conditional rendering allows you to display or hide the Geochart, based on defined data conditions.