Aggregate Models
Note
Aggregate models can only be used with the Salesforce data source type.
When creating a model in Skuid, there are two choices for model behavior: basic and aggregate. While the basic model is most frequently used, the aggregate model offers ways to collect, group, and summarize data, and they are particularly useful for creating custom reports and dashboards.
What is Aggregation?
Aggregation is combining separate sets of data into a single end result: a total sum; an average a count, a maximum or minimum. As opposed to updating individual pieces of information, aggregate models surface trends in data that are used for reporting and to support strategic analysis.
Aggregate models have two exclusive elements:
- Aggregations are a function (count, sum, average, minimum or maximum) performed server-side—before any data reaches a Skuid model—on a specific field for the large number of records that are accessed by the aggregate model.
- Groupings cluster or split out aggregations into separate rows within the model by using another field. Content is grouped so that the aggregations provide valuable insights.
Additionally, aggregate models also use:
- Conditions: As with all models, model conditions limit what data comes into the model, and allow for filtering that data on the fly.
- Actions: Model actions function the same way in aggregate models as they do in basic models.
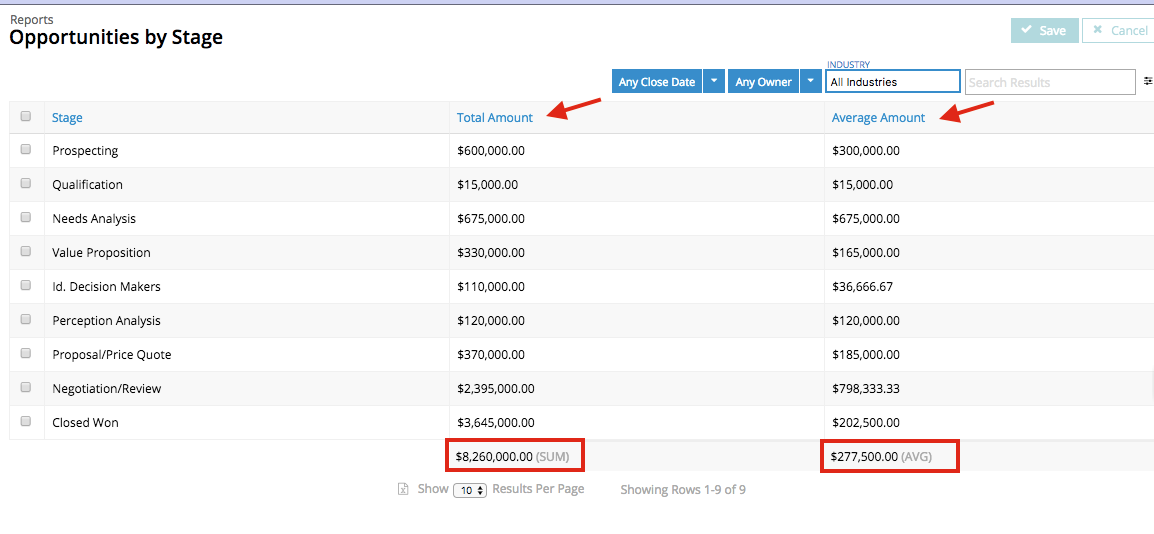
Imagine a Sales manager who wants to know the value of all the opportunities in their team’s pipeline, broken down by stage to get a better idea of the overall health of their pipeline. If the team is large, that could be a lot of records. Sure, the manager could view them, stage by stage, getting a total value for each stage, but this would take a lot of time, and they still wouldn’t be seeing the data all in one place.
What if there was a way to make a page that displays the total value of opportunities, grouped by stage—the total for all the prospecting leads, qualified leads, proposals submitted, etc.—plus a grand total for all stages? And, hey, maybe an average for each stage as well (go ahead, dream a little!) What if this page could be filtered by owner, to see how each member of the sales team was doing? Or by industry? Or by closing date? A page that might look like this:
Note
Already familiar with aggregate model concepts? Want to see them in action? Feel free to check out Aggregate Model Use Case: Aggregating Opportunities by Stage to build the Opportunity page discussed throughout this topic.
Create an aggregate model
In a Skuid page, click Models.
Click Add Model .
Edit the model properties:
Model Id: Give your model a unique name.
Data Source Type: Salesforce
Note
Aggregate models can only be used with the Salesforce data source type.
Data Source: Your Salesforce data source
Salesforce Object: The object that contains the fields to be aggregated.
Model Behavior: Aggregate
Max # of records (Limit): This field limits the number of groups—determined by a model’s groupings—displayed in components. Aggregations always retrieve all the records for a field, but if you only wish to retrieve the first X number of groups, you may use this field. It is typically recommended to make this field blank.
When the model behavior changes to Aggregate, the model elements shift from Fields, Conditions, and Actions to Aggregations, Conditions, Groupings, Actions.
Ordering fields in a table
If desired, it’s possible to records in ascending or descending order:
Click the aggregate model.
In the properties pane, edit Fields to order records:
Note
It’s only possible to order by fields that are being Grouped or Aggregated.
If ordering by a grouping: Enter the grouping’s API name (StageName, not Stage).
If ordering by an aggregation: Enter the aggregation by the formatted name of the aggregation, for example SUM(Amount).
Add a space and then the ordering function:
ASC
Click Save.
The records will now display in the order selected.
Aggregations
What criteria are used to choose what fields to aggregate?
Essentially, aggregations ask the user to determine what information they need collected or compiled across a large number of records.
Add an aggregation
Click the aggregate model.
Click Aggregations.
Click Add beside the field to be used for the aggregation.
- If using a SUM, AVG, MAX, or MIN aggregation function (see below), be sure to select a field that returns a numeric value.
Note
It’s not possible to aggregate on a field that is also used as the grouping field.
Click the new aggregation and select the type of aggregation for the selected field:
- Function:
- COUNT: Returns the total number of values in a field, for example, a COUNT of ID fields return the total number of records in the model.
- COUNT DISTINCT: Returns the total number of different values in a field, for example, a COUNT DISTINCT on the Owner Id field returns the total number of different owners (without double-counting the same owners across records).
- SUM: Returns the sum of all values for the selected field, for all the records in this model; only available for numeric fields.
- AVG: Returns the average value for the selected field, for all the records in this model; only available for numeric fields.
- MAX: Returns the highest value in the selected field, for all the records in this model; only available for numeric fields.
- MIN: Returns the lowest value in the selected field, for all records in this model; only available for numeric fields.
Alias Name: Every aggregation (and grouping) must have an alias. This field will autopopulate with a unique name; this means it’s possible to aggregate the same field multiple times with different functions. It’s possible to edit this name, but the Alias Name must be unique and have 3-25 alphanumeric characters.
Note
Use this Alias Name—not the API name—when referencing the aggregated field in components and merge syntax.
Warning
If updating an Alias Name in a model, the components that refer to the aggregation will not update. When changing an Alias Name, ensure to update it across all areas where it is referenced.
Both aggregations and groupings can be dragged and dropped into tables, similar to fields. They are also all displayed when “Add field” is clicked from a table.
Groupings
Having an aggregation of a particular set of data records can be useful, but how do to “compare and contrast” aggregated fields?
Groupings are a way to delineate data based on a specific field, in effect, to split a record’s rows and group them by that field. In the Opportunities example, a total amount for all Opportunities is nice to have but doesn’t really convey the desired information: what’s the value of our opportunities broken up by stage? Stage, therefore, is the grouping used to cluster the Opportunity data.
Think about the data being aggregated: how do should it be compared? What field will allow the greatest visibility into that comparison?
Create a grouping
Click an aggregate model.
Click Groupings.
Select the grouping method. There are two options:
Note
You can only choose one grouping method for the model, even if there is more than one grouping. If changing this method after adding additional groupings, it may be necessary to re-add those subsequent groupings.
- Simple: Use with aggregations that will product basic totals.
- Rollup: This grouping method calculates a SUM total of all rows—which are created by groupings—in the model, and appends that sum as an extra row to the model.
Note
As the rollup field is appended as a row to the end of a model’s data, setting a Max # of records (Limit) can prevent the rollup from displaying if the limit is reached before the end of the model’s groups.
Select the field to group by clicking the box.
- If grouping by a related object, click the arrow next to that object’s reference field.
Alias Name: Every aggregation (and grouping) must have an alias. This field will autopopulate with a unique name; this means it’s possible to aggregate the same field multiple times with different functions. It’s possible to edit this name, but the Alias Name must be unique and have 3-25 alphanumeric characters.
Warning
Use this Alias Name—not the API name—when referencing the aggregated field in components and merge syntax.
Note
When applying groupings to an aggregate model: for every grouping applied, the model will be grouped that way in all components—even if the grouping field is not represented in the component.
Multiple groupings
If groupings provide a way to “slice” up aggregations into meaningful buckets, is there a way to similarly split a group for increased granularity?
There is: multiple groupings. Imagine a page that aggregates the quarterly closed sales for reps by region. That’s a region field used as a grouping. But to break each region down to the individual rep, add a second grouping on the Owner ID field.
Now there are two grouping columns: the region itself, and a breakdown of individual reps within the region.

Simple rule: the more groupings used, the more delineated the data.
Note
If an additional grouping is added to the aggregate model, but the grouping field is not added to the table, the table will nonetheless display the data with that grouping applied.
Using reference fields for groupings
Reference fields can be used for groupings, with a few caveats: when grouping with reference fields, Skuid creates groupings for both the id field and the plain language name field. Make sure to have both groupings (and do not delete either).
The name field is used in the page display, but the id field is critical to using the reference field for splitting the data.
Conditions
Just as in basic models, aggregate models use conditions to limit the queried data coming into the model.
Working with the Salesforce HAVING clause
Per Salesforce documentation, HAVING is an “optional clause that can be used in a SOQL query to filter results that aggregate functions return.” This clause can be employed as a model condition to filter data, but cannot be added declaratively. Instead, it must be added by editing the XML for the Skuid page, and adding the clause under the model’s conditions, using the same format as other conditions.
Working with the HAVING clause is only recommended for advanced Skuid users who are comfortable editing XML. To learn more about this process, see the Filter on Count community post.
Working with aggregations in components
In a Table component
Column summaries
Summaries are a standard Table component element that appear at the bottom of a table’s column, and they display the result of an aggregation while disregarding groupings. Because of this, summaries are excellent way to utilize the delineation of groupings while still displaying the whole picture of a model’s field data.
To select which summaries the column should display:
- In the table, click on the aggregated field.
- (Optional) In the field properties, create a Custom Label for the field. This label will display at the top of the column.
- In Column Summaries, click Select Summary Type(s) and choose the summary type(s) from the picklist:
- Sum
- Average
- Min
- Max
- Median
- Click Save.
If more than one summary was selected, they will display in the order they are listed in the picklist.
Note
Column summary calculations are based on the rows in the model, a property set by the Max # of records (Limit) field. For example, with Max # of Records set to 5, only 5 rows—or groups of aggregations—would display in components. The summary would then only be performed on those 5 rows.
Warning
Do not use summaries when using the Rollup grouping method. Since the rollup is appended as an extra row within the model, summaries will use that extra row when performing their calculations. This can result in some erroneous calculations—like summing all the rows and then doubling that sum!
In a chart component
It’s possible to use a basic model with visualizations like charts, but basic models have different limits on the amount of data they query. If the chart has a very large record set, using a basic model may result in an inaccurate visualization; the page would likely benefit from an aggregate model.
Warning
If the page throws an Apex heap size error, using an aggregate model is required: there’s simply too much data for a basic model.
Aggregations and charts
Charts are, in effect, aggregations of data made visual. The aggregation functions used by charts are similar to those used by aggregate models: average, sum, max, min, and count (there is no “count distinct” in charts).
If creating a page that uses multiple aggregate models and multiple series (which aggregate data) in a chart, then it’s critical that the Alias Name for each aggregation in the aggregate model be unique.
For example, with two models that aggregate a SUM on an amount—even an amount from a different object—the default Alias Name for both of these aggregations will be sumAmount. If left this way, the Alias Names are not unique; this may cause one of the series in the chart to fail to render. This is easy to fix: edit the aggregate models to give each aggregation within the models a unique Alias Name.
Best practice: When creating unique Alias Names, try to include content that identifies the purpose of the aggregation.
Want to learn more about using charts? Check out Visualizations: Charts and Graphs.
Troubleshooting
Because aggregate models include a number of moving parts, basic troubleshooting starts by checking all the elements needed to make the models work. Here’s a checklist:
- Make sure there is not a number in the Max # of records (Limit) field for the model.
- Is there a Grouping field on the aggregate model?
- Are all the fields used on the table included in the aggregate Model?
- Are they set to the right summaries?
- Ordering fields: Are the fields used for ordering identified correctly?
- If ordering by a grouping, use the grouping’s API name (StageName, not Stage).
- If ordering by an aggregation, use the aggregation’s formatted name, for example SUM(Amount).