Aggregate Model Use Case
Aggregating Opportunities by Stage
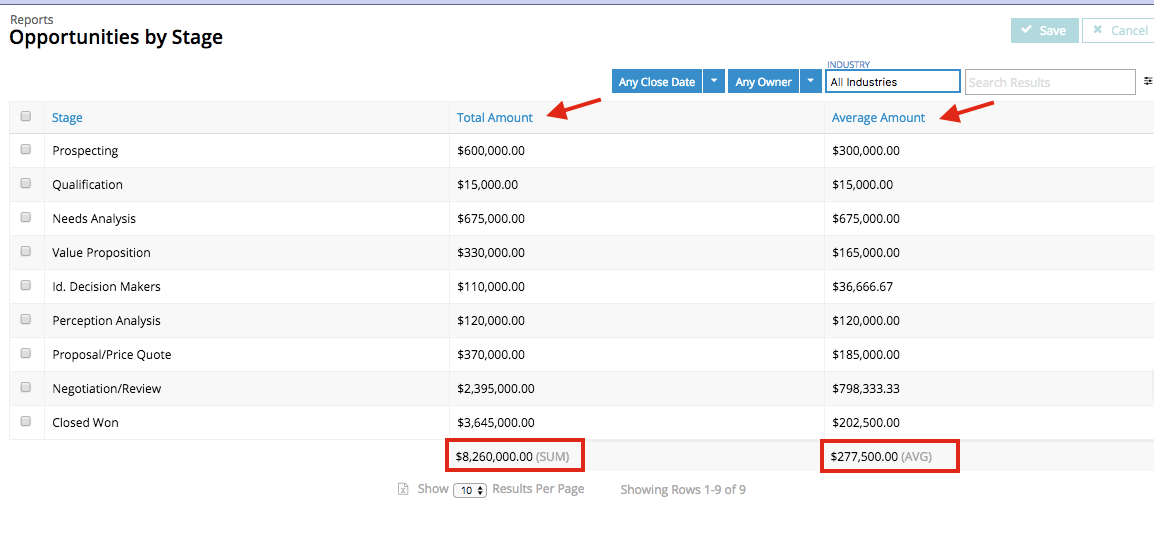
The topic aggregate models offered a number of use cases, including one in which a Sales manager wanted to quickly see the value of all opportunities in a team’s pipeline, broken down by stage, plus an average by stage. The Sales Manager also wanted to filter by owner, close date, and industry, with a resulting page that looked like this:
The best way to get familiar with aggregate models is to make one. So let’s build this page!
Note
Aggregate models are available for Salesforce and SQL data source types.
Assumptions
Note
We’re assuming you have a Salesforce data source created. If not, create one now.
a model on the Salesforce Opportunity object
a model on the Salesforce User object with the following configuration:
Property settings
- Max # of records (Limit): Blank.
- Fields to Order by: Name.
Fields included in the model
- Name (Full Name)
- Id (User ID)
- Data Source Type: salesforce
- Data Source: the name of your Salesforce data source
- Primary Object: Opportunity
- Click Compose > New Page.
- Give the page a unique name (no spaces).
- Click Next Step.
- Select Use a page template, the click Select Page Template.
- Select Object list/tab page.
- Click Create Page.
Create the aggregate model
In the new page just created:
- Click on the Opportunity model and make the following changes:
- Model Behavior: Aggregate.
- Max # of records (Limit): remove number to make this field blank.
When the model behavior is changed to Aggregate, the model features will shift from Fields, Conditions, and Actions to Aggregations, Conditions, Groupings, Actions.
Click Aggregations: the right pane displays a list of fields. We want to aggregate on the Amount field to get a total amount for all opportunity records.
- Click Add next to the Amount field to create this new aggregation
- Click the Amount aggregation.
- In the Aggregation Field pane, select:
- Function: SUM
- Alias Name: Skuid will auto-populate this field.
So, now that we’ve got an aggregation for the sum of the opportunity amounts, lets do a second one for the average of the opportunity amounts.
- Click Add next to the Amount field to create this new aggregation
Note
We’ll be using the same field, but a different aggregate function.
- Click Aggregations to see the list of fields again.
- Click Add Amount to create a second aggregation.
- Click this new aggregation.
- In the Aggregation Field pane, select:
- Function: AVG
- Alias Name: Skuid will auto-populate this field.
- Click Add Amount to create a second aggregation.
Great, so now the model knows to aggregate opportunity amounts into totals and into averages. But this use case calls for a grouping to govern how the data will be displayed within Skuid components.
- Click Groupings:
- Grouping Method: Simple
- Search for and check Stage, the field we want to group the opportunities by. A new grouping is displayed beneath Groupings.
- Click Save.
Great! Now the page has an aggregate model. Preview the page now; it will look pretty empty. Time to configure the page components to display the data.
Set up the page
First set the Page Title component:
- On the page, click on the title bar of the Page Title component.
- In the Properties bar, make the following changes:
- Title: Opportunities by Stage
- Sub-Title: Reports
(Want to get rid of that Salesforce header? Check out the Create a Custom Header and Footer.)
Next, set up the Table component:
Since this page was created from a template with Opportunity as the primary object, the table should already be connected to the correct model and object.
- Delete any default fields that were created with the table by clicking the X on the field itself. These fields were based on the previous Basic model and will not display aggregate data.
Click the Table component within the canvas.
In the Skuid Table Properties pane, check Show Export Button.
- This allows export of the results that display on the table into a document—a report that can be shared and printed.
Click Show Export Button, and the Export Options button displays in the table in the App Composer. Click it and set the export properties for reports.
In the Table component, click Add Fields > Model Field(s).
- Because this is an aggregate model, the only fields available will be those used in the aggregations and the grouping.
- Check StageName, SUM(Amount), and AVG(Amount) (in that order) and click Apply the fields to the table. (You can also rearrange the fields into the correct order.)
- Click on the SUM(Amount) field in the table and make the following changes in the field properties:
- Custom Label: Total Amount
- Column Summaries: Sum. This will add a total of all entries at the bottom of this column.
- Click on the AVG(Amount) field in the table and make the following changes in the field properties:
- Custom Label: Average Amount
- Column Summaries: Average. This will add an average of all entries at the bottom of this column.
Click Save and then Preview.
Now there’s a list of Opportunity Stages, with a Totals column and an Average column with entries for each stage. Nice, yes? But wait—there’s more! Wouldn’t it be nice to filter that table?
Add conditions to the model
Don’t want to see all Opportunities created since the team started tracking them? How about limiting what’s coming into the model by Close Date? Return to the App Composer to set up a condition that enables just that.
- In the Opportunity model, click Conditions.
- Click Add to add a condition.
- In the condition, set:
- Field: CloseDate
- Operator: is
- State: Filterable Default Off
- In the condition, set:
And wouldn’t it be nice to limit whose opportunities are displayed?
- In the Opportunity model, click Conditions.
- Click Add to add a second condition.
- In the condition, set:
- Field: OwnerID
- Operator: is
- State: Filterable Default Off
- In the condition, set:
Create filters
Now that there are conditions set on the aggregate model, set up filters on the Table component displaying its data.
Closing Date filter
First, lets filter by Close Date of the Opportunity:
- Click the Table component within the canvas.
- In the Table component, click Add Feature > Add Table Filter.
- Click on the new filter and edit the following Filter properties:
- Filter Type: Select Option
- Pick Options and Conditions: Manually
- Model Conditions to Affect: CloseDate
- “None Selected” option text: Any Close Date.
- Click the filter label in the Properties pane.
- Click Add Option Source (Any Close Date - CloseDate). Leave the Source Type as Manual.
- Click the newly created option source.
- Click Add Option next to Source: Manual.
- Click the new option and edit the following properties:
- What Condition(s) will this Option affect?: Affect the Default Condition
- Label: Closing: This Year
- Value: THIS_YEAR
- Click Save, and click Preview.
Okay, there’s a filter for closing dates. Add a couple more options to that filter:
- Click the option source, and click Add Option next to Source: Manual.
- Click the new option and edit the following properties:
- What Condition(s) will this Option affect?: Affect the Default Condition
- Label: Closing: Last Year
- Value: LAST_YEAR
- Click the option source once more, and click Add Option .
- Click the new option and edit the following properties:
- What Condition(s) will this Option affect?: Affect the Default Condition
- Label: Closing: This Fiscal Year
- Value: THIS_FISCAL_YEAR
- Click Save, and click Preview.
Terrific: three closing date filter options.
User Filter
Now let’s filter by user:
- In the Table component, click Add Feature > Add Table Filter.
- Click on the new filter and edit the following Filter properties:
- Filter Type: Select Option
- Pick Options and Conditions: Manually
- Model Conditions to Affect: OwnerID
- “None Selected” option text: Any Owner
- Click Save, and click Preview.
So, there’s a filter button, but it’s not very useful, is it? There’s a reason for that: need to add a model for the User object, so that the page know who the users are.
- Click Models.
- Click Add Model and edit:
- Model ID: OppOwners
- Data Source Type: Salesforce
- Data Source: The name of your Salesforce data source
- Salesforce Object Name: User
- Model behavior: Basic; this doesn’t need to be an aggregate model.
- Max # of records (Limit): remove number to make this field blank.
- Fields to Order by: Name
- Add fields:
- Name (Full Name)
- Id (User ID)
Don’t want to see all the users in the org, just the ones that own an opportunity? That makes sense—and it’s easy to fix with a condition:
- Under the OppOwners model, click Conditions.
- Click Add Condition and edit the condition:
- Field: Id
- Operator: is
- Value:
- Content: Result of a subquery
- Join Object: Opportunity
- Join Field: OwnerId
- State: always on
- Click Save.
This condition will only return users who own opportunity objects. But the “Any Owner” filter still needs some adjusting:
- In the table, click the Any Owner - OwnerId filter.
- In Filter Properties, next to Any Owner, click Add Option Source.
- In the new option source, make the following edits:
- Source Type: Rows in a Model
- Merge Source: OppOwners
- Option Label Template: Owner: {{{Name}}}
- Which Conditions will this Source’s Options affect: Just the Default Condition
- Value to Inject into Default Condition: {{id}}
This last item is the field (on the User Object) to be injected into the Owner Id condition (on the Opportunity object). End users will see the opportunity owner names in the filter, while Skuid inserts the appropriate ID behind the scenes.
Industry Filter
Finally, let’s set up a filter for industries:
- In the Table component, click Add Feature > Add Table Filter.
- Click on the new filter and edit the following Filter properties:
- Filter Type: Select Option
- Pick Options and Conditions: Automatically
- Filter Field:
- Click the field-picker.
- Click the arrow next to Account ID. This navigates to the Account fields, where the Industry field is lurking.
- Click on Industry’s radio button
- “None Selected” option text: All Industries.
- Depending on how many industry values exist in the org, Skuid may display an autocomplete filter. To change this, update or remove the value in the Switch Filter to Autocomplete at X Items field.
- Click Save, and click Preview.
Congratulations on creating a dynamic report that can filter by close date, owner, or industry–or all three.