Enhancing Charts with Actions
Skuid offers two chart-specific ways to enrich visualizations with additional data:
- On-click actions let users click locations on the chart to open popups or sliding panels, navigate to other pages, or perform other actions.
- Chart drilldown allows the builder to create a set of nested charts. Users can click from one chart to the next to “drill down” into a deeper level of the data presented in the preceding chart.
Both options leverage the power of the Action Framework to add deeper levels of data to charts and geocharts.
On-Click Actions
On-click actions are added to a chart when configuring the data series. The added action then fires when the user clicks on the associated series or region data within the chart or geochart.
Assumptions
Note
The following steps assume you have a functioning Chart component, connected to a model with at least one data series created.
Add an on-click action
- Click on the chart in the canvas, then click the Series tab.
- Select the series where you want to add an on-click action.
- Click Add On Click Action and select the Action Type.
You can select almost any action from the Action Framework to use as an on-click action.
A common use case: the user’s click opens a popup or a sliding panel that provides additional data to the chart through a Table, Field Editor, or even other visualization components (within that popup or panel).
Split Type charts
Leveraging on-click actions with the Split Type property in the data series is a great way to display different data for each split in the series:
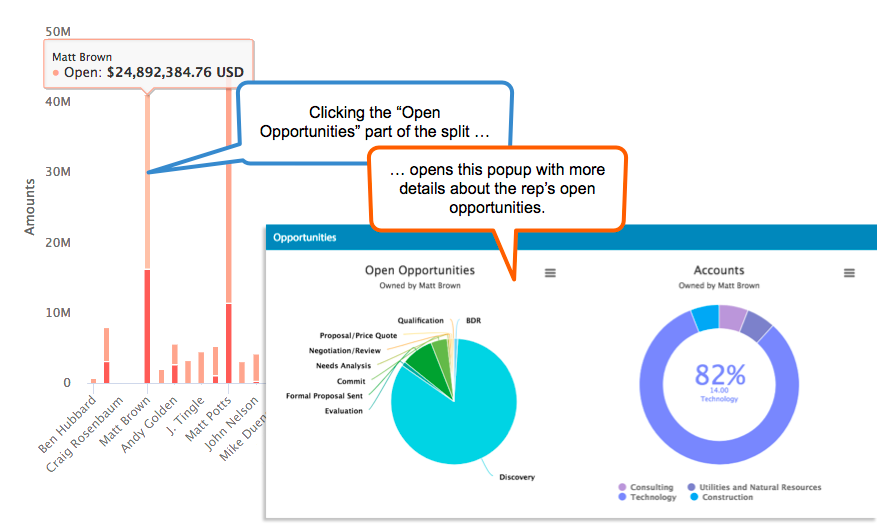
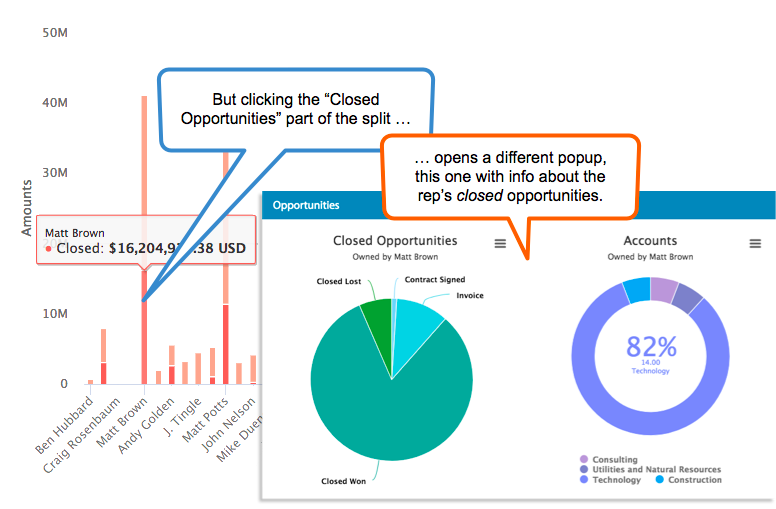
Chart Drilldown
The drilldown feature creates a set of related charts in a hierarchy. For example, when a user clicks into the top-level chart, Skuid opens the next-level chart. Drilldowns can display additional information from the same model, or related information from a different model. Use either visualization component, chart or geochart, in a drilldown.
There are two steps to creating a chart drilldown:
- Creating a chart set and adding a new chart to it.
- Creating a drilldown action to link the first chart to the second.
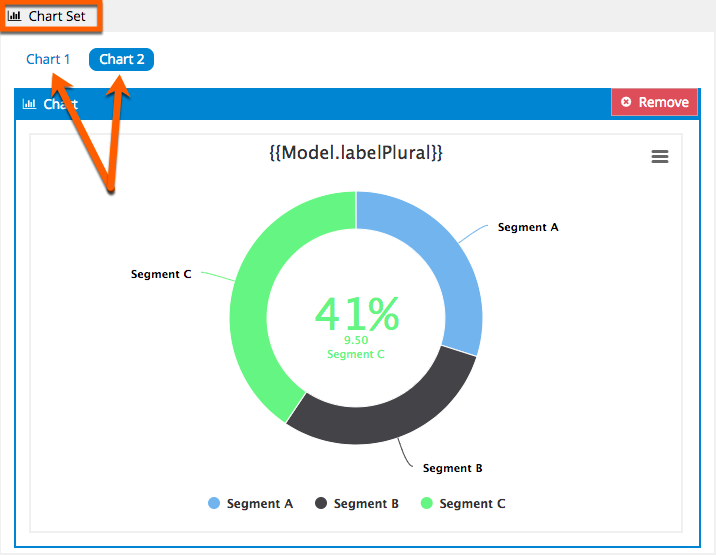
Create a Chart Set
Drilldowns are built on the concept of the chart set, a set of related charts that appear at the same location on the Skuid page.
Assumptions
Note
The following steps assume you have a functioning Chart or Geochart component, connected to a model with at least one data series created.
Convert the current visualization into a Chart Set:
- Click the component’s header to activate an Add Drilldown button.
- Click next to Add Drilldown to open the drop down list, and select one of the options
- Chart to add a Chart to the set
- Geochart to add a Geochart to the set.
Both visualizations now sit within an “envelope” called the Chart Set. You can add multiple visualizations to a Chart Set.
Note
Each chart needs configuration and styling.
Delete a chart from the Chart Set
- In the Chart Set, click on the button for the chart that needs to be deleted.
- On the chart itself, click Remove to delete the Chart or Geochart.
Add a drilldown action to connect charts in a chart set
Charts in a Chart Set must be connected to one another with a Drilldown action so that they can pass data from one chart into the next one:
- Select Chart 1 in the Chart Set.
- In the chart’s properties pane, click the Series tab.
- Click on the Series that will pass data from Chart 1 into Chart 2.
- Click Add On Click Action
- In the new Drilldown action, check to see that it is configured as follows:
- Action Type: Drilldown.
- Drilldown Chart: Select the next chart in the series from the drop down.
Repeat this for any visualization in the Chart Set that has a chart for the user to drill down into.
Context and Chart Actions
In a common use case for on-click actions, the user clicks a chart item to open a popup or sliding panel with additional information about that item. Similarly, with Drilldown actions, the user clicks an item on the first chart to open the second chart with more information on that item.
But how does Skuid know what content to display in the popup, sliding pane, or new chart?
Context. Skuid uses a parameter—a specific value for the data that was clicked—and passes that information into the follow-on charts or components, to ensure that the contextual data drives the subsequent display.
Context with on-click actions in popups and sliding panels
To set context for the components in a popup or sliding panel, click the component’s header to display the property pane and make adjustments on the Context tab.
Context with Drilldown action
To set context for a drilldown action, navigate to the drilldown action itself in the Series tab. When the drilldown action is created, a context condition is also added. (Create additional context conditions by clicking Add Context Condition from the Drilldown action.)
Edit the context condition
Field: The field on the chart to drill down to
Merge Field: The field on the current chart
Note
The correct parameter is often the record Id, so this is the default for both properties. If necessary, select a different value by clicking Select Field.
Operator:
- in (default): The drilldown chart will display records where the context is “records that are in the element” clicked by the user in the first chart
- not in: The drilldown chart will display records where the context is “records that are not in the element” clicked by the user in the first chart
Note
$Chart merge variables are useful for when working with drilldown and on-click actions.
Id or not Id?
Because the correct parameter is often the record Id, the context properties default to this. Why might you need to use a different parameter?
Imagine a pie chart displaying current sales opportunities. An on-click action launches a popup with a Table component showing the accounts associated with those opportunity records. If the record Id for the opportunity is passed in, the Table won’t know which accounts to display, because the Id is for opportunity records, not account records.
But if the context condition is changed so that the Id passed is not the id for the opportunity (usually “Id”) but the Id for the account (for example, “AccountId”), then this can be matched to the record Id on the account entity attached to the table.